
Recommendation
 based on reviews by Samuel Alizon and 2 anonymous reviewers
Each and every one of us will recall the severe acute respiratory syndrome (SARS) coronavirus (CoV-2) pandemic, and the national and international political hesitations in its management. Fall 2019, in the city of Wuhan, Hubei province, China, an outbreak of unusual viral pneumonia due to a new emerging coronavirus named as SARS-CoV-2 started, generating late February a modern pandemic called COVID-19, posing very serious threat to global public health and the world economy (Hu et al. 2021). As we are getting out from this pandemic, and even if viral variants are still circulating, what have we learned and retained from this difficult period, shaking our certainties and reminding us of past images of devastating plagues? The COVID-19 pandemic highlighted the importance of early action, widespread testing, open data sharing, and strong public responses (The Lancet Infectious Diseases 2024). It has also highlighted that the animal origin of SARS-CoV-2 was still unknown and the existence of a reservoir host not really demonstrated (Cohen 2021). Beyond this, the COVID-19 pandemic has also revealed the importance of early and continuous surveillance, also raised questions about the role of meteorological conditions on the dispersion and viability of this virus, and highlighted the devastating effects of social inequality. We all remember some medical doctors who became modern preachers announcing the end of the pandemic because of unfavorable weather conditions coming for viral spread!
However, epidemiological studies analyzing the role of different parameters, and effects of national and regional restrictions at local or regional scales on COVID-19 are still rare. In this investigation entitled “Spatial and temporal epidemiology of SARS-3 CoV-2 virus lineages in Teesside, UK, in 2020: effects of socio-economic deprivation, weather, and lockdown on lineage dynamics”, Moss and collaborators’ aim is to analyze how a range of parameters, using both generalized linear mixed- and Bayesian spatial modeling, affected positive cases in the Teesside subregion of North East England during 2020 (Moss et al. 2024). Also, the authors wanted to understand the impacts of national and local government interventions introduced this year affected disease conditions in this subregion showing high levels of deprivation due to deindustrialisation in the latter half of the 20th century.
According to Moss et al. (2024), the UK government decided for a heterogenous ”tier” system of local restrictions in England during the second wave associated with a more stringent national lockdown. The intention was to be more responsive and appropriate to the different English local contexts. The authors take us through a detailed statistical analysis to show that disease patterns in Teesside were associated with demographic parameters, social deprivation, weather conditions (essentially temperature) and governmental health interventions. Interestingly, findings lead to the conclusion that local tier interventions by public authorities was less effective at reducing COVID-19 cases in Teesside than a strict, long-term national lockdown. A closer look at the spatio-temporal dynamics of the eight most common SARS-CoV-2 lineages circulating in Teesside in 2020 reveals complex dynamic behaviours differing to those of the total positive cases, certainly due to environmental and demographic stochasticity, and sublocal heterogenous social and economic conditions.
Overall, we recommend reading this study, which reveals the complexity of dealing with epidemics and pandemics, and highlights the importance of sound national political decisions and difficulties to proceed to local adjustments, i.e. tier system, in epidemic and pandemic control.
The present recommendation is resulting from thorough reviews produced by Samuel Alizon and two anonymous reviewers, and which I thank very much for their review works here.
References
Jon COHEN. 2021. Prophet in purgatory. Science 374, 1040-1045. https://www.science.org/doi/epdf/10.1126/science.acx9661
Ben HU, Hua GUO, Peng ZHOU, Zheng-Li SHI. 2021. Characteristics of SARS-CoV-2 and COVID-19. Nat Rev Microbiol 19, 141-54. https://doi.org/10.1038/s41579-020-00459-7
The Lancet Infectious Diseases. 2024. Have we learned anything? Editorial. The Lancet Infectious Diseases 24, 793. https://doi.org/10.1016/S1473-3099(24)00439-0
E.D. Moss, S.P. Rushton, P. Baker, M. Bashton, M.R. Crown, R.N. dos Santos, A. Nelson, S.J. O’Brien, Z. Richards, R.A. Sanderson, W.C. Yew, G.R. Young, C.M. McCann, D.L. Smith (2024) Spatial and temporal epidemiology of SARS-CoV-2 virus lineages in Teesside, UK, in 2020: effects of socio-economic deprivation, weather, and lockdown on lineage dynamics. medRxiv, ver.5 peer-reviewed and recommended by PCI Infections. https://doi.org/10.1101/2022.02.05.22269279
Dear Editor,
The authors may be commended for their extensive work to improve their analysis and manuscript.
I'm satisfied with their answers to my comments. I do not have further comments.
https://doi.org/10.24072/pci.infections.100192.rev21DOI or URL of the preprint: https://doi.org/10.1101/2022.02.05.22269279
Version of the preprint: 4
Dear Prof Guegan
Please find attached our detailed response to the three reviewers comments. We would like to thank the reviewers for their feedback, and hope you agree that we have been able to address their main concerns, and that their advice has helped to improve the quality of the paper.
Yours sincerely
Roy Sanderson
, posted 29 Nov 2023, validated 29 Nov 2023Dear co-authors,
We have now received comments from three referees. As you will read, these three referees have produced very substantial comments. They appreciated the quality of your work, but all three also asked general (e.g., more information needed for better reading by non-UK readers, interpretation of results) and more technical questions about the choice of statistical tools/methods used. They also question possible biases in your analyses.
Based on these three reports, I suggest that you respond point by point in a reworked version of your article, and that you re-submit it to the journal as soon as you can.
With many thanks for choosing *PCI Infections* to submit your work.
Best regards,
J.-F. Guégan
The authors present a local study of the number of positive SARS-CoV-2 tests aiming at relating the number of positive tests to external factors like weather conditions, social deprivation, and NPI.
While there is some descriptive value to this work, I believe it has at least two fundamental flaws:
1- Homogeneity of exposure and collinearity issues: While they advocate that using a small area allows for fine-grained analysis which may be lacking in other studies, interventions like NPI (either lockdown or local tiers) are applied in the whole area with no differentiation. It would have been different if they had included other areas in the UK but they did not. Or, if they had chosen to use a proxy of mobility reduction (phone data, or Google mobility index) but again they did not use such data. Hence, the robustness of their data can be questioned as some results may just be coincidental. Also, in some cases, they just had to discard important variables due to collinearity like "lockdown 2" and Tier 3 for B.1.1.7, which is unfortunate as one could hypothesize that those measures may have delayed the emergence of B1.1.7.
The second flaw may be the most problematic.
2- They do not account for the fact that COVID-19 is a communicable disease. They do not account in their model for the difference in transmissibility between variants and that epidemic spreading has a non-linear behavior. Other researchers managed to perform studies similar to the one the authors tried to complete (Paireau et al BMC Inf Dis. 2023 doi: 10.1186/s12879-023-08106-1, or Collin et al. Inf J Biostat 2023 doi: 10.1515/ijb-2022-0087) and found results exactly opposite to the ones presented here. The difference with the other studies is that the scale of the study is larger, and they used models to account for the epidemiological spreading of the diseases. This is not just a methodological difference, it's a fundamental flaw that totally invalidates their results.
There are also a number of additional major issues, the main ones being:
- They do not mention the potential heterogeneity of community testing which can vary for example in time and by socio-economic factors. Factors like implementation delay (particularly during the first year of the pandemic), or pandemic fatigue (during the second wave) may greatly bias the representativeness of the real number of cases. They seem to pool pillar 1 (hospital based testing) and pillar 2 (community testing) as if they had the same meaning, timing, and value which can only bias their results. They could have provided analysis on pillar 1 only to limit the issue, but they would have lack power.
- Their data includes both hospital-based and community testing. That kind of testing will occur at different moments over the natural history of the disease. One will be further in time from the infectious event than the other. However, they choose to apply the same 2-week lag to all temporal variables. They do not justify this choice nor explain how it may potentially bias your results.
- I'm unsure about how they deal with the dependency of the observations when using glmm. Observations at t+1 strongly depend on observations at time t due to the communicable nature of COVID-19. Hence, they should not be able to directly use glmm on these data. Also, the homoscedasticity assumption may be wrong in this case, which bias at least the error estimates and the confidence intervals.
https://doi.org/10.24072/pci.infections.100192.rev11Summary
The authors analyse the spread of SARS-Cov-2 lineages in 2020 in an area of the UK (the Teesside area, in the North-East and far from London) using screening data. For this, they combine testing performed in hospitals (pillar 1) and in the general population (pillar 2). First, they used Bayesian spatial modeling to infer the area-specific risk of having a positive test relative to the overall risk (across all districts). Second, they used a frequentist mixed-effect modelling approach to identify the factors associated with positive PCR testing in each postcode and included many potential effects (location, date, number of tests performed, SARS-CoV-2 lineage, whether, governmental non-pharmaceutical interventions). The results show a bimodal trend for the number of positive tests with 8 lineages dominating. There were also clear spatial patterns in terms of the number of positive tests, with strong variations between lineages. The mixed effect model showed that the strongest positive effects for the total number of PCR tests were the imposition of Tier 2 or Tier 3 control measures, whereas the ones with the strongest negative effects were the first lockdown and, to a lesser extent, the temperature. For each lineage, there was some variation in the effects that had the largest effect. The authors also perform some sensitivity analyses, for example, to check for the consistency between Pillar 1 and 2 or to incorporate the overdispersion of the data. Overall, this work illustrates the spatial and temporal variation in the incidence of SARS-CoV-2 in a UK area in 2020.
Review
I found the figure elegant and the effort to tease apart the effects on SARS-CoV-2 incidence commendable. Some of my major issues with the manuscript can easily be addressed and have to do with the lack of details (especially for a non-UK audience) and with the interpretation of some of the results. A third concern is more generic and has to do with the choice to restrict the study to a single area in 2020. Finally, I am unsure about the soundness of some statistical decisions (but this is not my strong suit).
1) Study focus
The authors decided to focus on a community of 550,000 inhabitants from January to December 2020.
1.1 They justify the geographical scope by the lack of studies performed at a local scale. This might be the case but then, why only include a single community? Is it for technical reasons (e.g. if there is a lot of manual curation to perform)? Otherwise, it seems that including more communities could have brought more power to disentangle factors that would be not identifiable at such a local scale.
1.2 The authors also restrict their approach to the year 2020 and, unless I missed it, do not justify this focus. I thought that Pillar 2 had continued at least until 2022 and it seems strange not to include this data because by doing so the study has the same limitation as the myriad of studies from 2021 that were hampered by only being able to follow a single season.
1.3 At any rate, given the focus of the article, the introduction may not need to discuss too much the unfolding of the pandemic.
2) Results interpretation
2.1 I found that the authors put a lot of emphasis on demographic factors but these appear rather limited in Figure 4. For example, the estimate for the population size is very low compared to that of the NPIs (but perhaps it needs to be rescaled?). Furthermore, the one for social deprivation has a confidence interval that spans from 0 to 1 when analysing all the cases (I am surprised that it comes out as significant), while it is non-significant for nearly all the lineage-specific effects.
2.2 About the NPI effects, the opposite trend between lockdown 1 and the other NPIs perhaps warrants some more discussion. In particular, I was puzzled because the methods indicate that the model tests "the time since imposition" of an effect whereas the discussion (line 411) interprets it as an effect of the lockdown. Perhaps this is the case (meaning that the figure and Discussion were written after correcting for the effect) but at least it is potentially misleading.
2.3 The authors mention urban vs. rural post-codes (line 383) but it was unclear how they tested this because this co-variate does not appear in the GLMM.
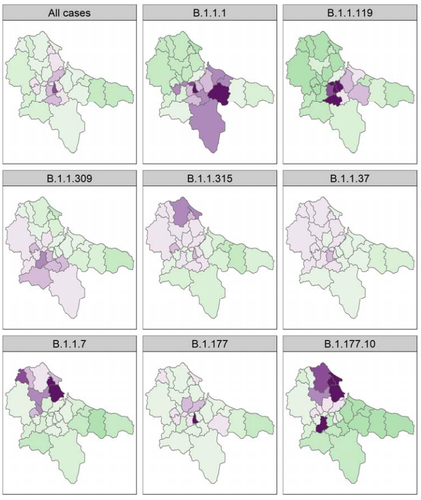
2.4 At a spatial scale, from Figure 3, it looks like the first wave (B.1.1.119) hit the center (more urban?) and the second wave (B.1.177 and B.1.17) hit the north of the area (more rural?). The authors mention that immunity can be ruled out because of a lack of correlation between the positive tests (lines 458-459) but it is unclear how this was tested for.
3) Correlated variables
Many of the variables the authors investigate appear to be very correlated. This is the case for instance regarding the virus lineage and the day of the year since the vast majority only peaks one (B.1.177 being the main exception). I think this might also be the case for weather-related variables.
To address this issue in the GLMM, the authors use a VIF test to remove one of the correlated variables and reperform the test. This is fine but, unless I am mistaken the choice of the correlated variable removed is arbitrary. For example, in Figure 4 the week is removed but couldn't another variable correlated with it be removed instead? Perhaps showing which of the variables were highly correlated with the ones removed (at least for the global model) would help interpret the results.
4) Spatial random effects
This is outside my area of expertise but I was unsure how the spatial and temporal auto-correlations were handled in the GLMM. Based on my reading, it looks like a random intercept is used to capture both the postcode and the time effect (line 226). I was expecting two random effects, one for the spatial aspect (e.g. in 2D with the spatial coordinates) and another for the temporal effect (e.g. with a spline) but perhaps I am missing something here.
Detailed comments
line 75: I was a bit surprised by this statement because there have been loads of articles trying to identify the effect of a variety of interventions. The problem is that many of them only analysed the first wave, which means they have very little power. But perhaps few of these models have considered UK data (although it would seem surprising given the quality and availability of this data).
line 151: is the testing in Pillar 2 done at random? Put differently, is the testing a good proxy of the incidence? If so, it should be clarified. If not, it is obviously a huge issue.
line 153-154: Were all the positive tests sequenced? If so, please clarify it otherwise it seems that two databases are used (one for the tests and another for the sequencing).
line 167: Were the weather variables assumed to be homogeneous throughout the area studied?
line 215: please explain the DIC acronym.
line 218-245: writing a formal version of the model in the Appendix would help understand the methodological steps.
line 235-237: Why did you choose a two-weeks delay? This seems appropriate for Pillar 1 (hospital admissions occur 10 to 14 days post-infection) but it seems exagerated for Pillar 2 (95% of the testing positive would be between day 2 and day 11). Furthermore, as the sentence is written, it looks like the individual test-seeking behaviour was at play, which seems inconsistent with the fact that Pillar 2 was testing at random and not based on symptoms.
line 262: When testing the correlation between the tests in Pillar 1 and Pillar 2, where the time series treated as a set of independent (paired) observations? Because the temporal correlation could amplify the signal.
Figure 3 is beautiful but it suggests that the pattern is driven by lineages whereas it could also be temporal. Perhaps the latter representation would be more neutral.
Figure 4 is nice but having different scales for the different panels can be misleading. Perphaps use a single scale, at least for the lineage-specific figures.
lines 427-429: This seems to be a bit redundant with the part in lines 414-416.
[signed and dated]
- Samuel Alizon, 28 Nov 2023
